


.webp)


.webp)
VT225t
Room monitoring unit
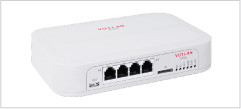
VT335t
Monitoring unit
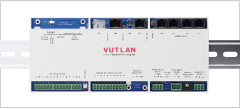
VT336t
Industrial monitoring unit
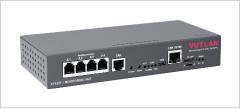
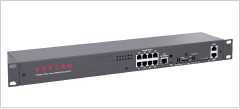
VT825t
Remote monitoring unit
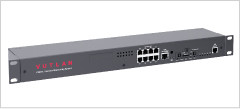
VT855t
Data Center Monitoring Unit
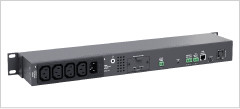
VT604t
Switched PDU with 4 outlets
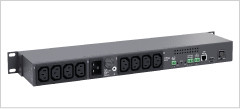
VT608t
Switched PDU with 8 outlets
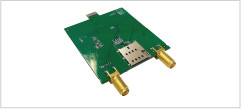
VT7670
LTE slot modem
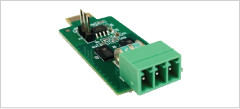
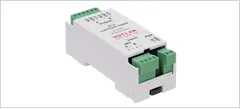
VT485m
Modbus RTU extension
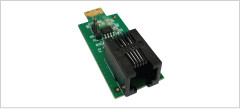
VT485r
Reader extension
VT-BAT
backup battery
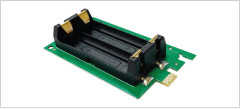
VT-ACCU
Rechargeable backup battery
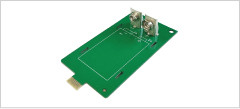
VT12
Relay Module

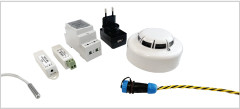
Alarm becons & Strobe lights
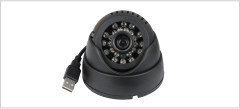
Cameras

Readers
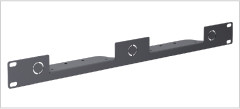
Mounting brackets
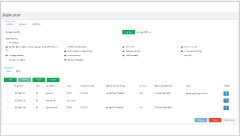
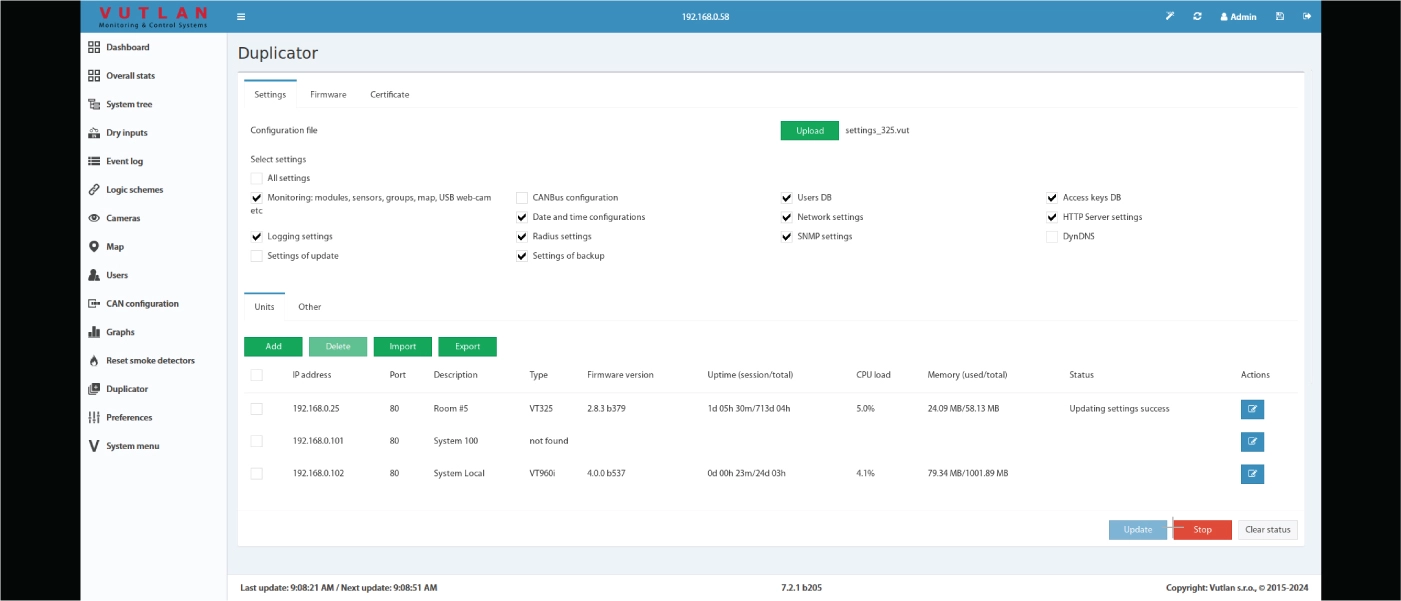
Duplicator program
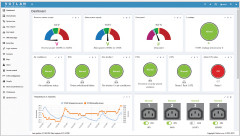
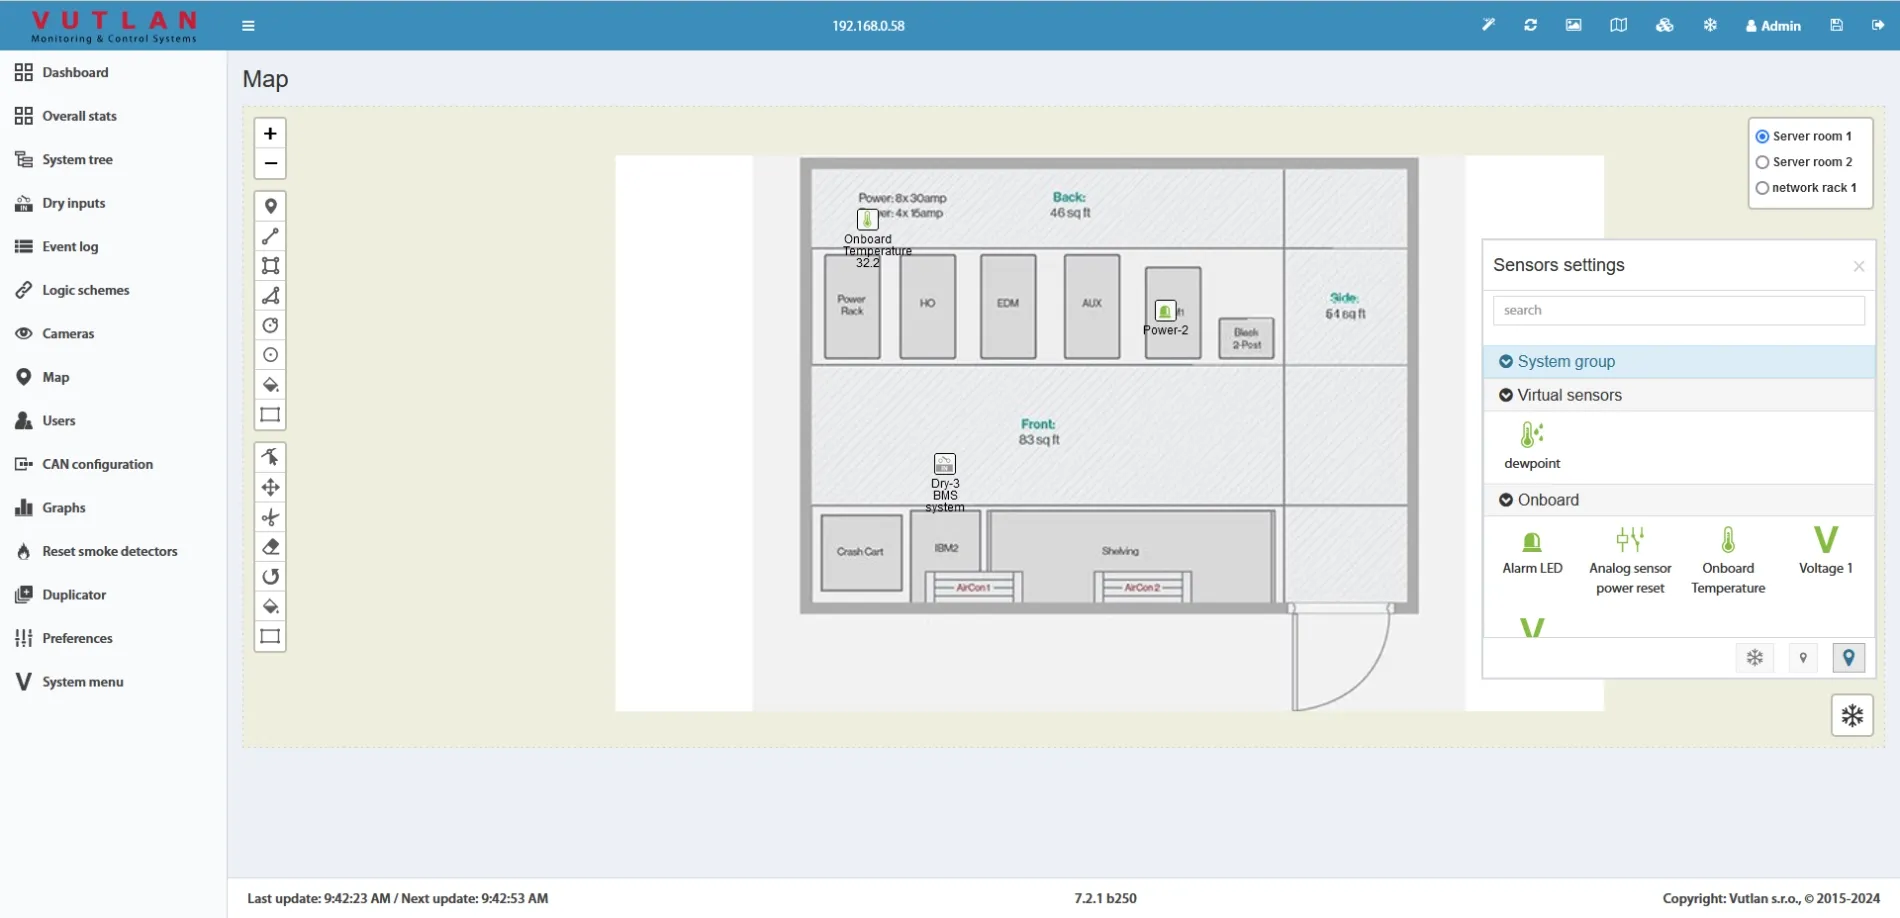
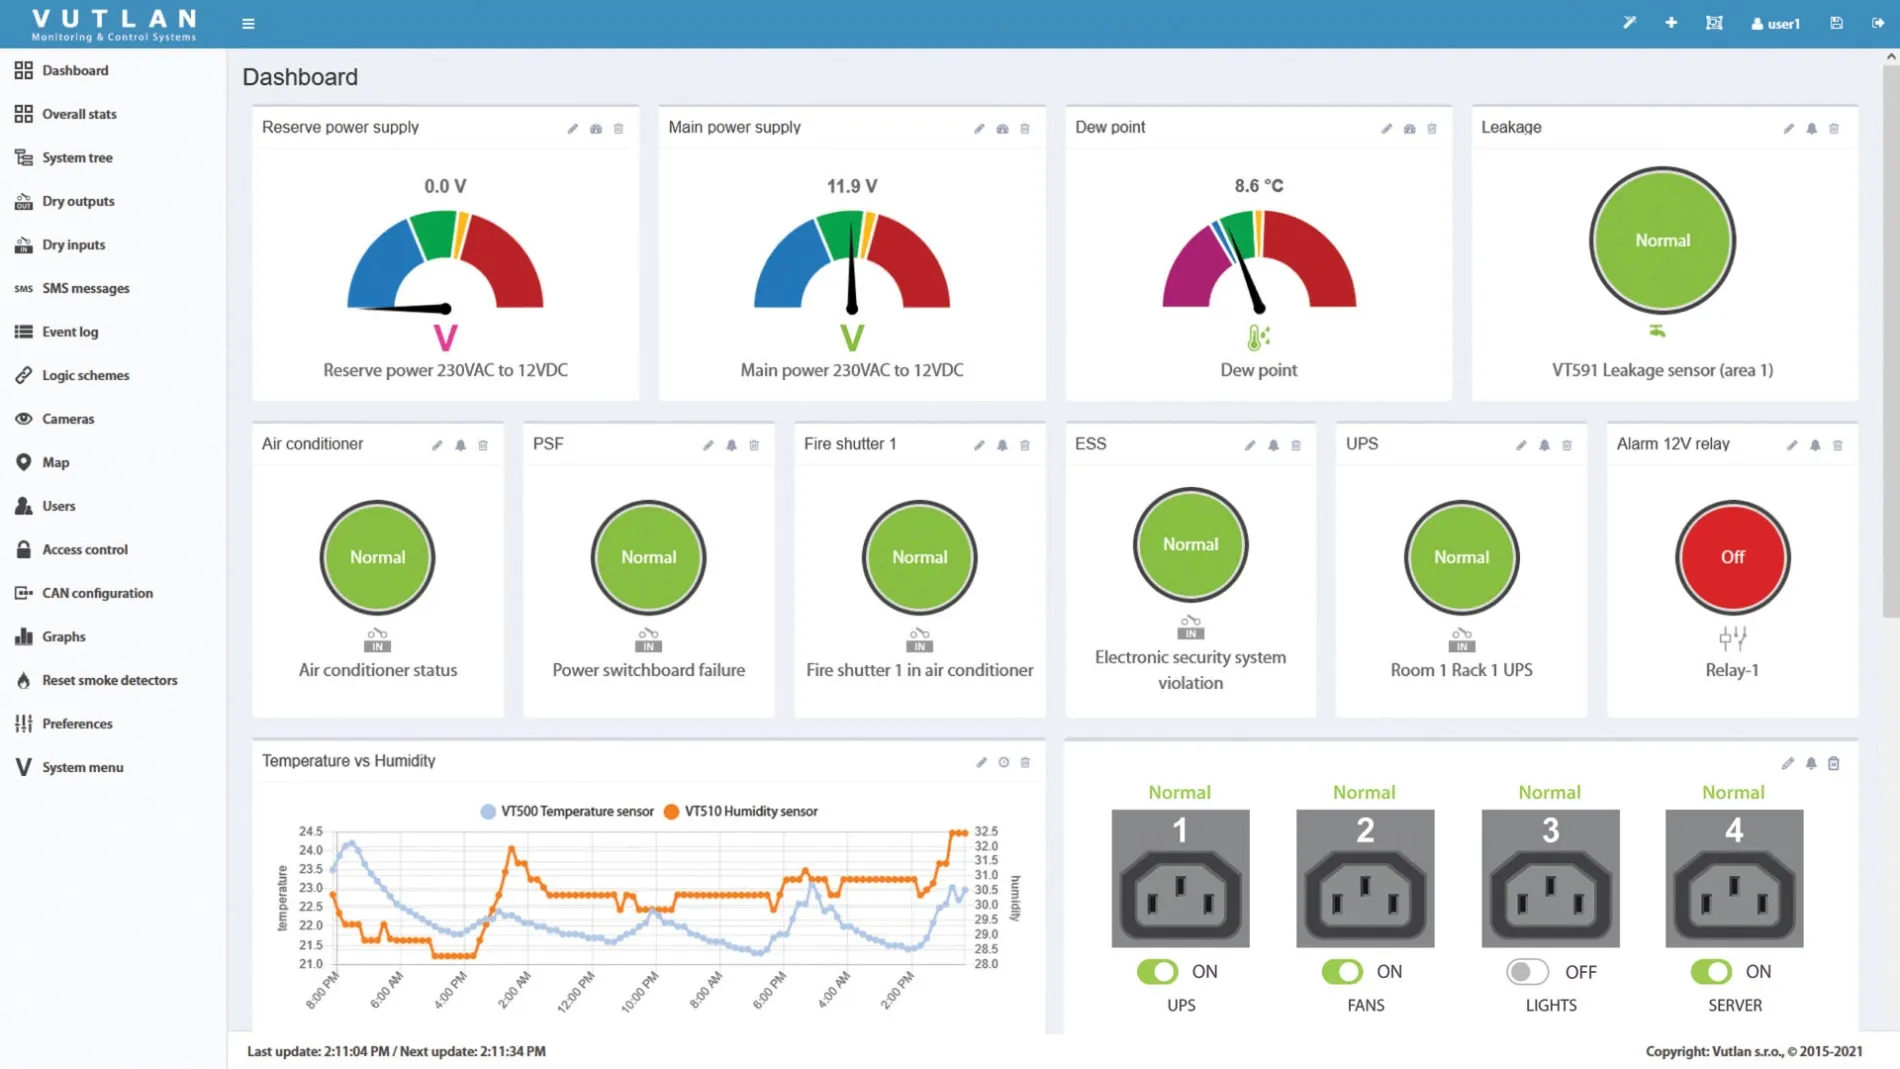
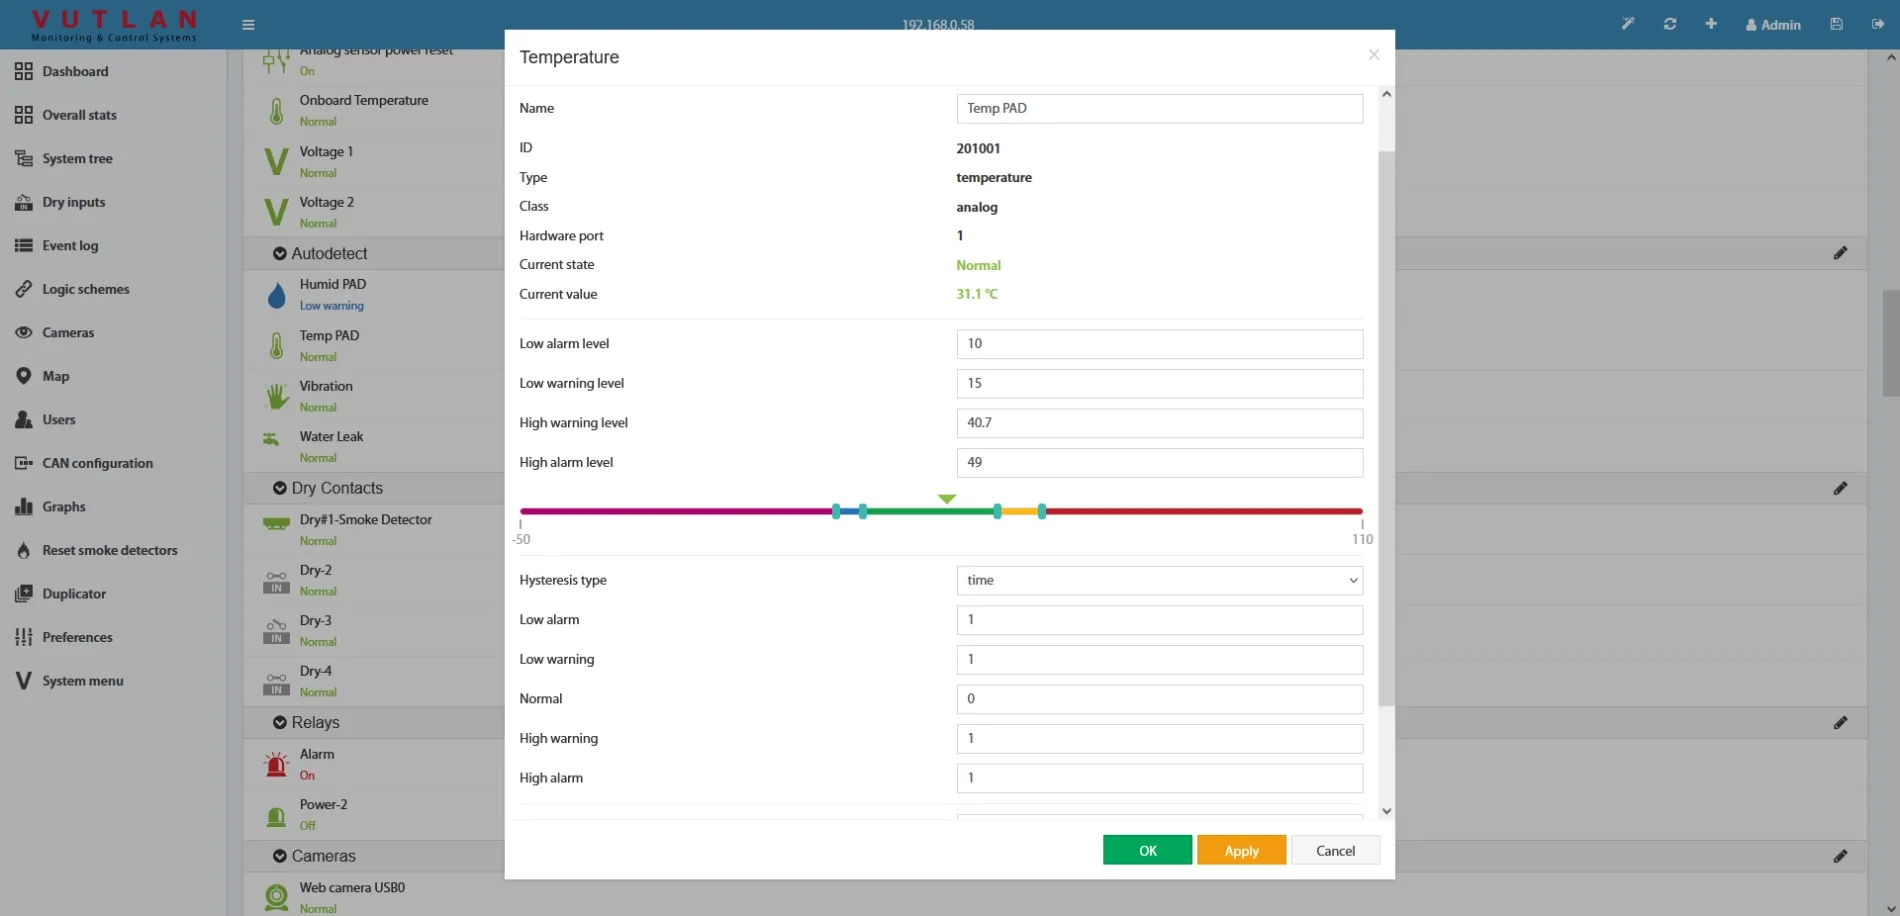
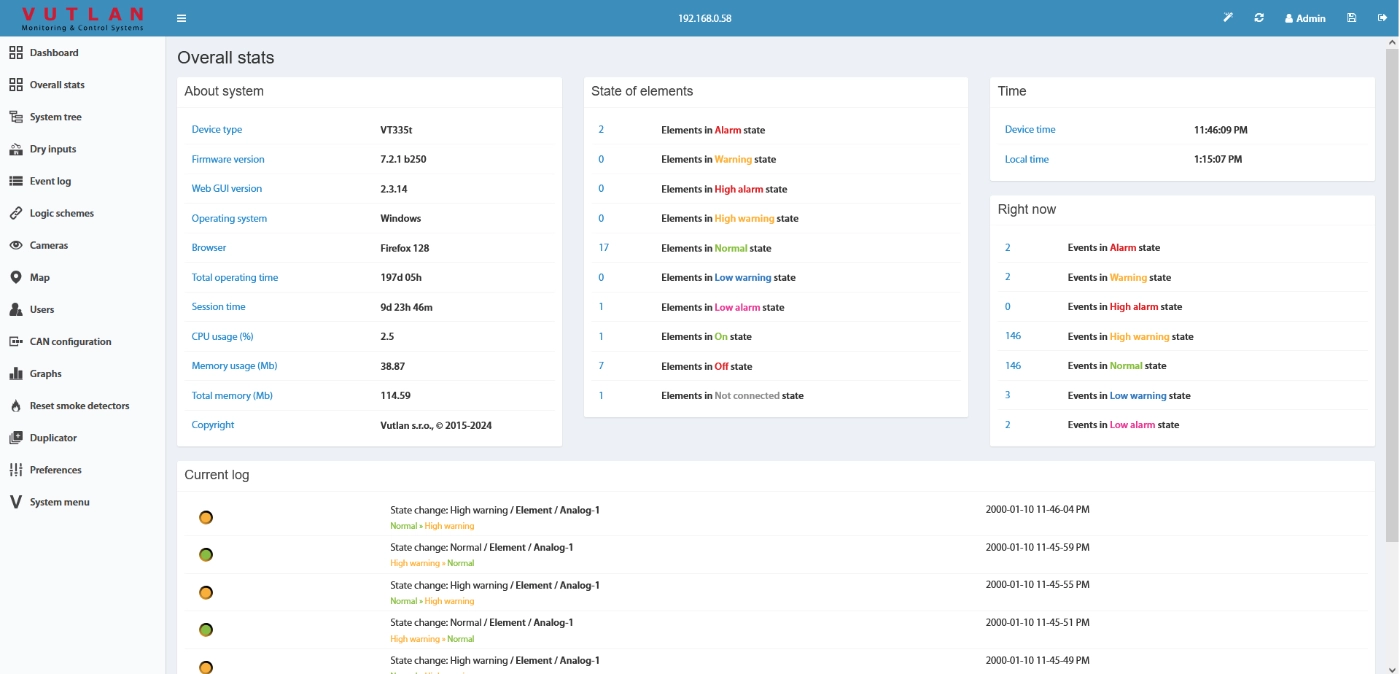
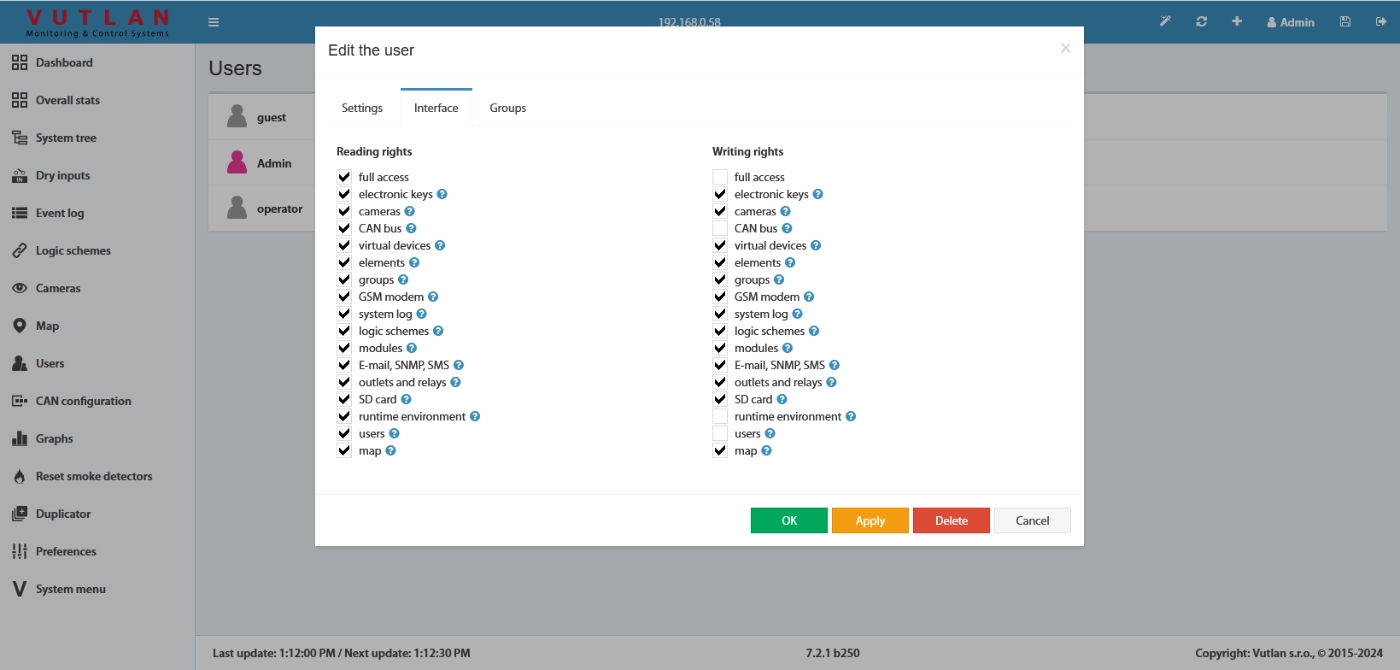
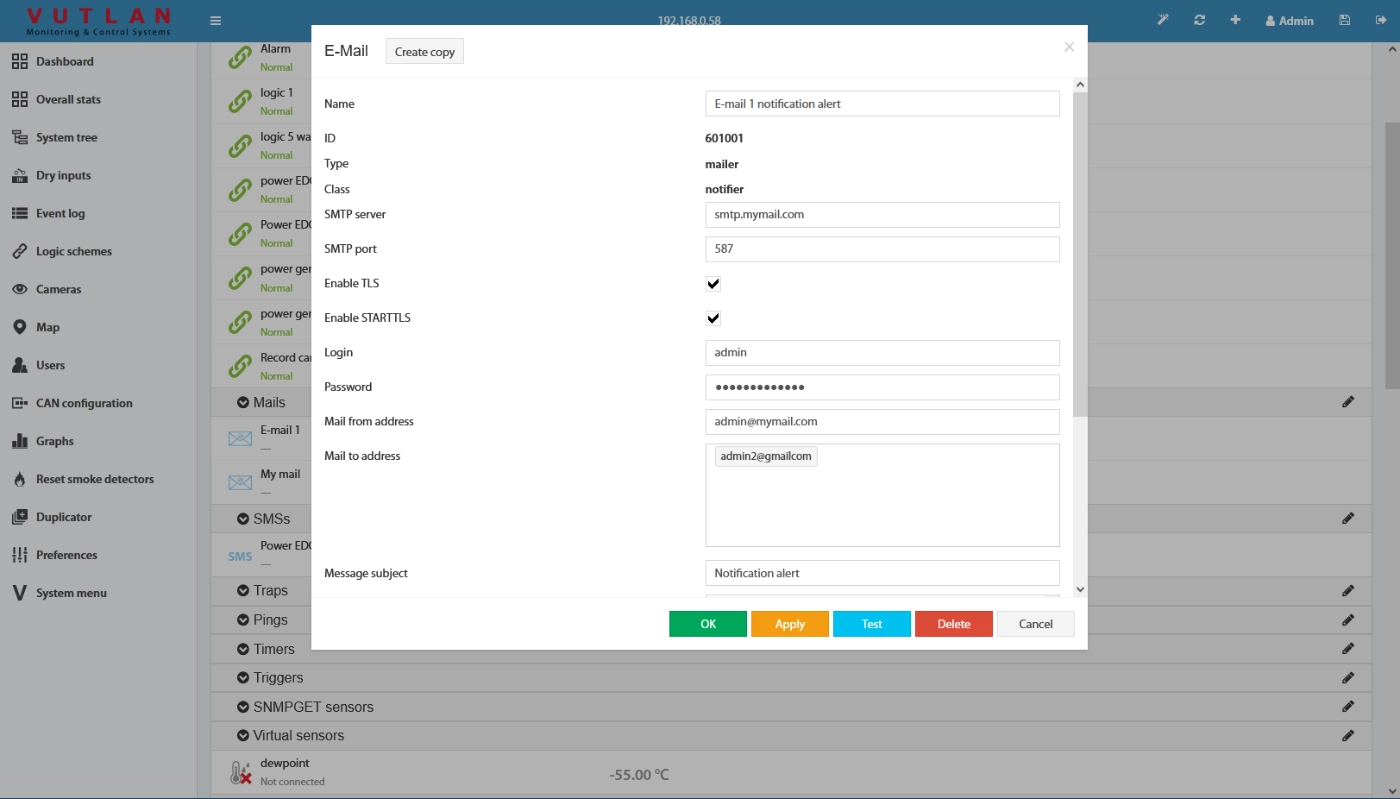
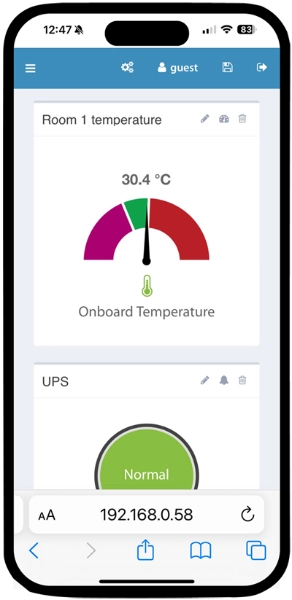
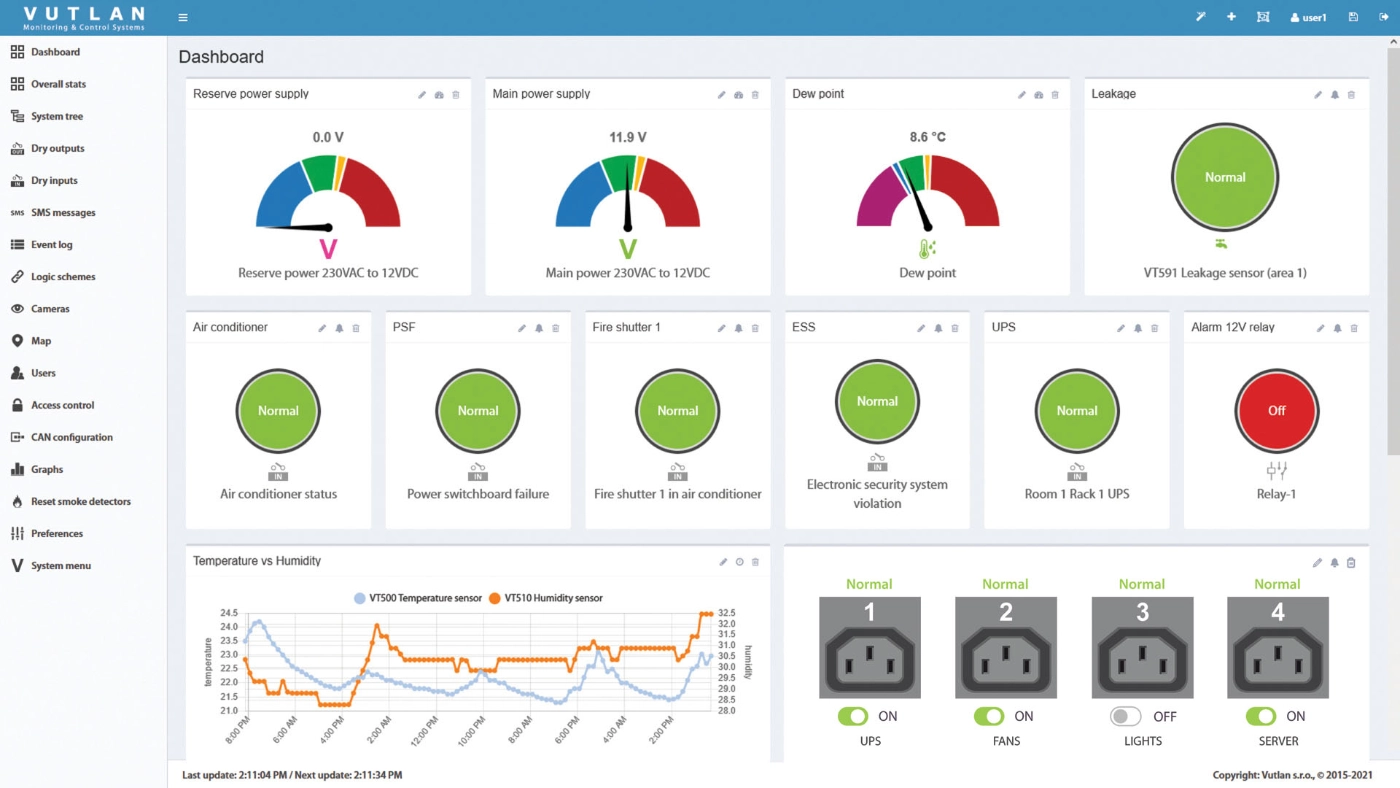
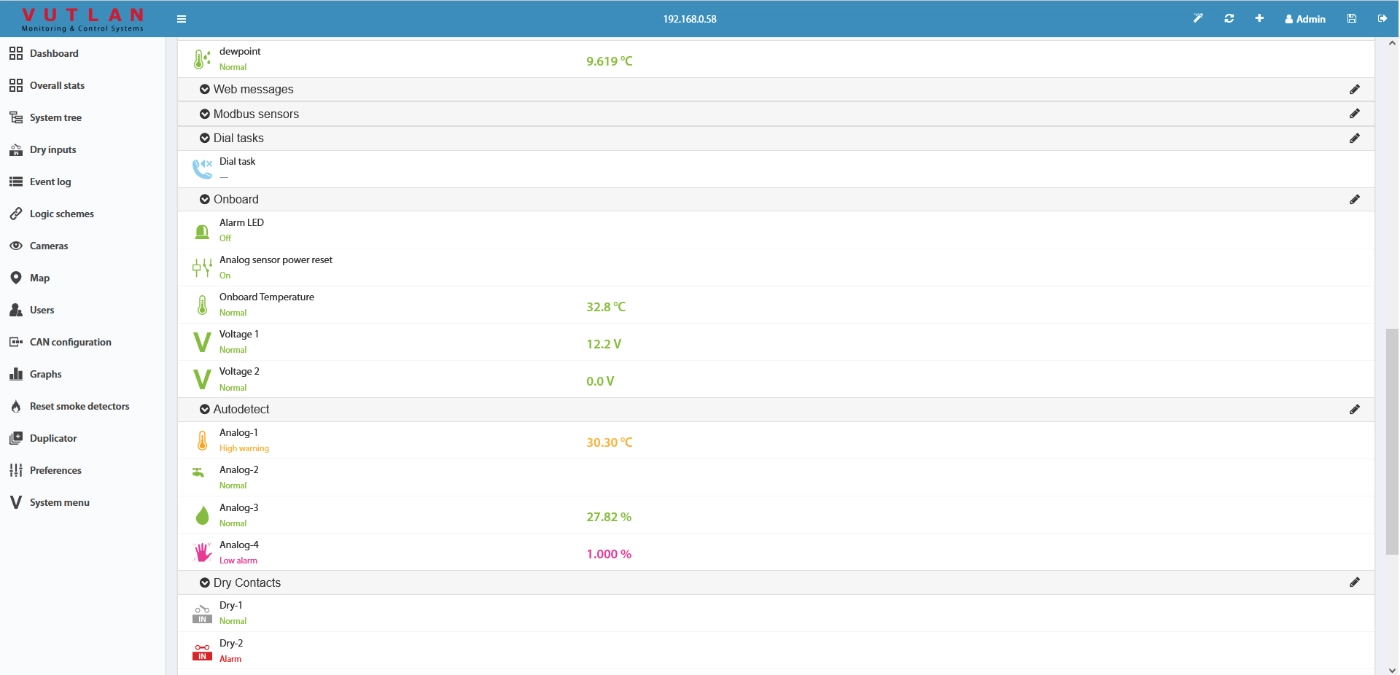
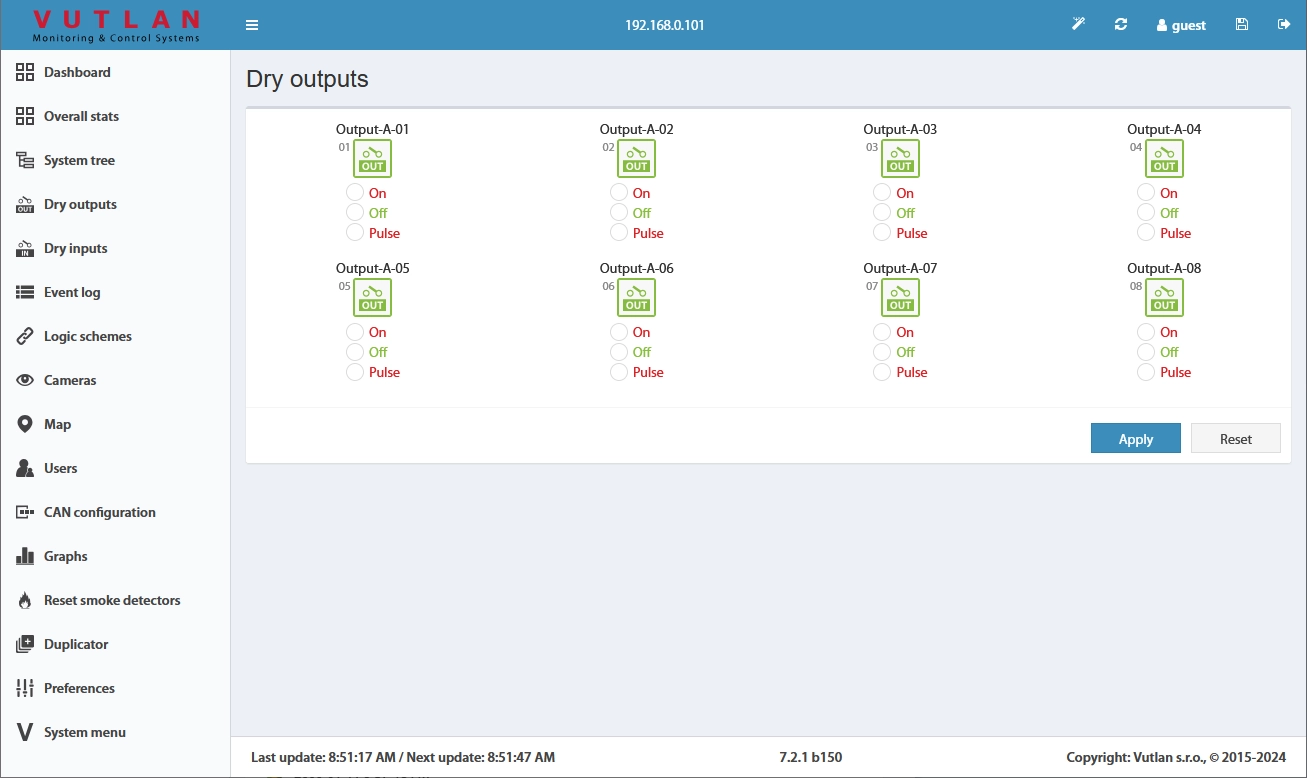
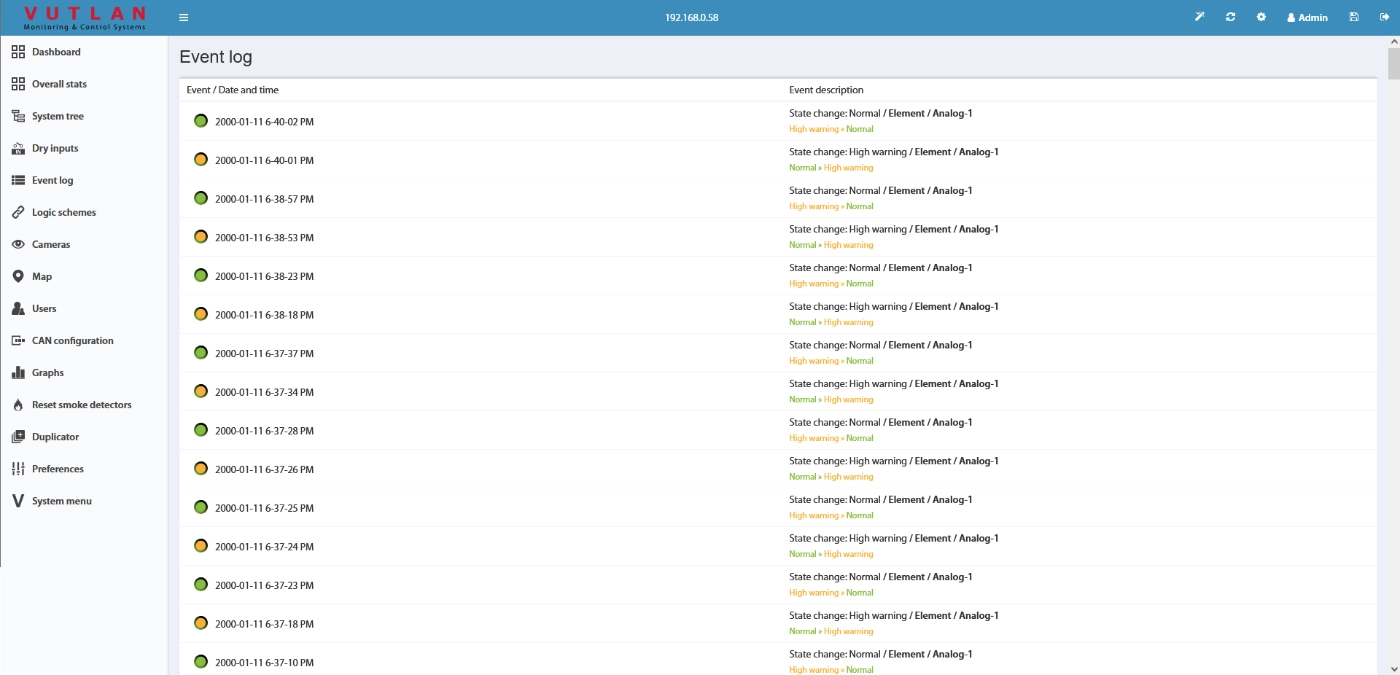
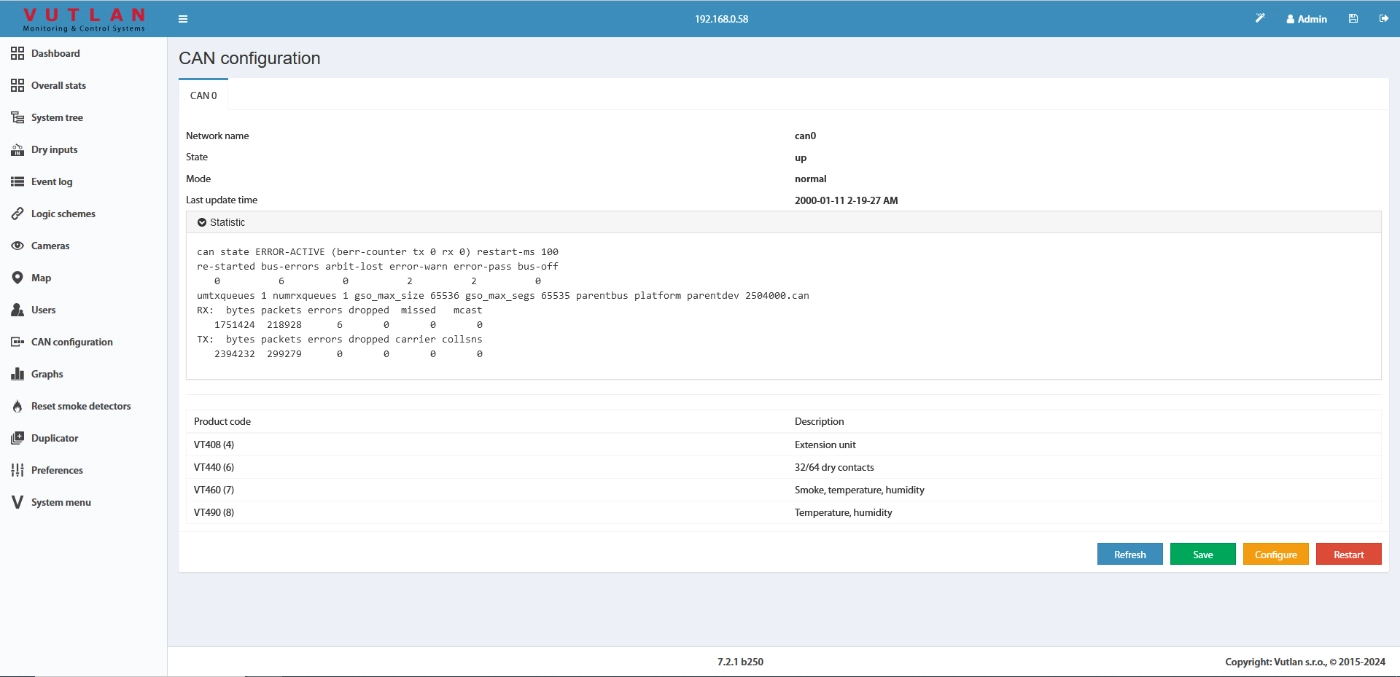
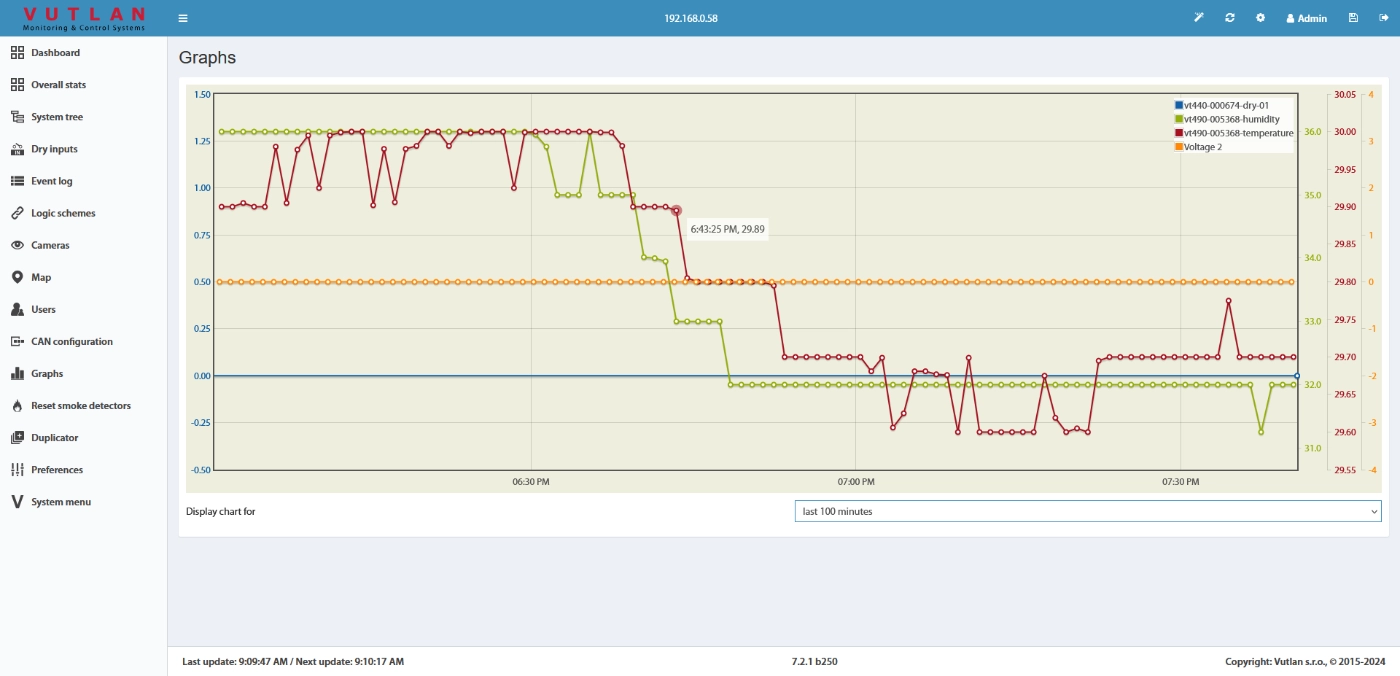
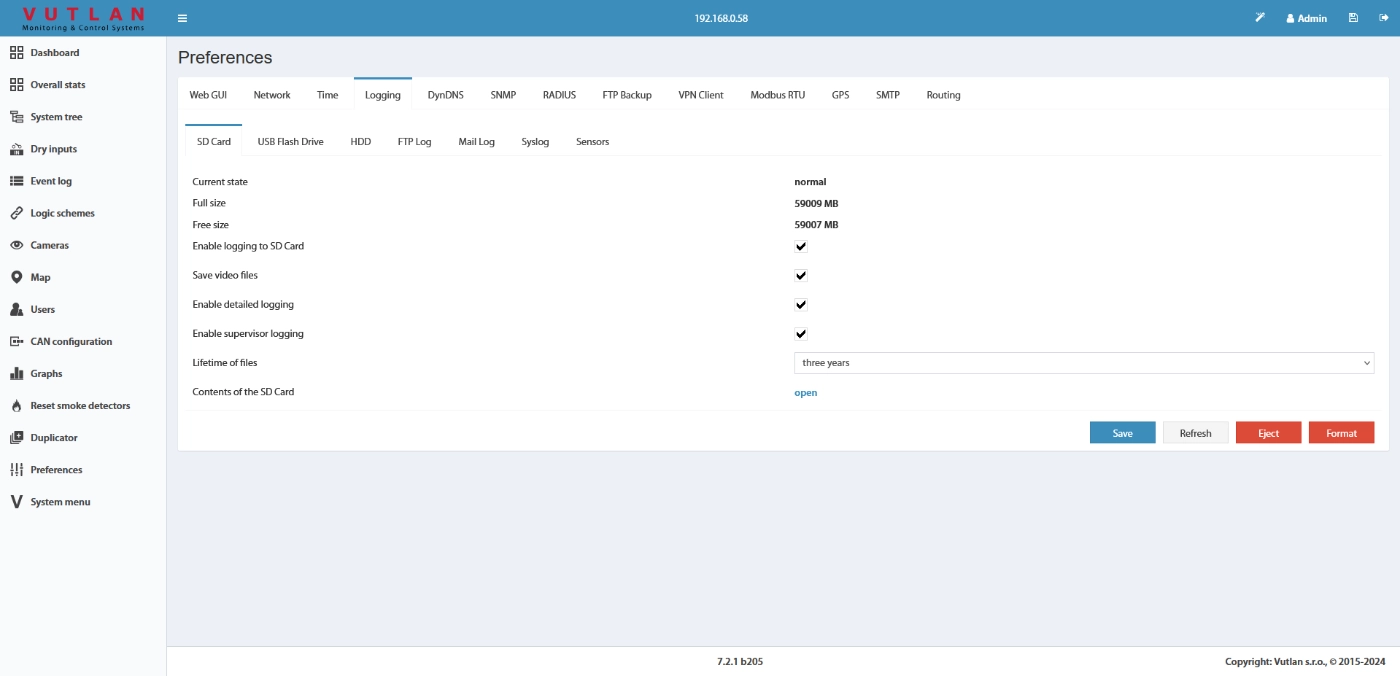
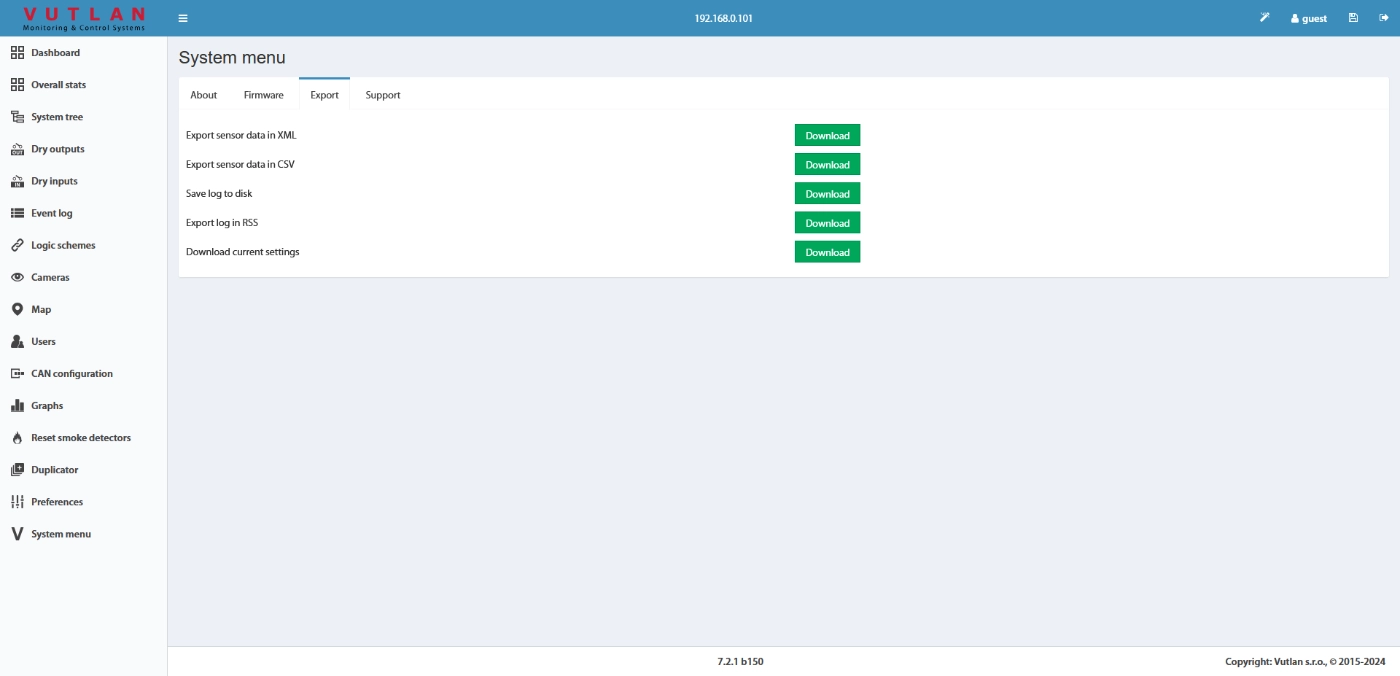
Web Interface

SNMP
Managment software