.webp)
SNMP Monitoring Software
SNMP Monitoring Software enables data center and facility managers to closely monitor and efficiently utilize their existing data center IT infrastructure. Features include comprehensive monitoring tools; visibility and awareness tools; proactive planning; reporting; multi-tenant capabilities; extendible architecture; stable, reliable & respected platform; vibrant community, and customizable code.
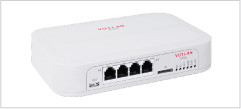
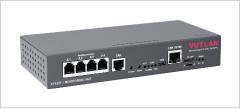
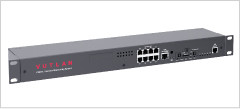
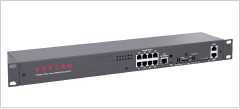
Integration of Vutlan monitoring system in NMS
Vutlan systems support SNMP v1, SNMP v2c, SNMP v3.
Required MIB files are included with all Vutlan units.

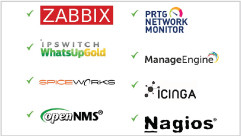
Paessler PRTG, Zabbix and hundreds other
View examples of how to connect some of the most popular SNMP management software to Vutlan equipment. Download scripts and templates or view examples at VIEW.
- Paessler PRTG
- Zabbix
- Open NMS
- Sunbird DCIM
- SolarWinds
- Cisco Nexus
- IBM Data Center Services
- Centeros DCIM
- ABB Decathlon
- ManageEngine
- Nagios
- Amazon Cloud Watch
- WhatsUp Gold
- Datadog
- and many others...
Features of SNMP Software packages

This is heading element
- Capabilities to monitor applications, services, operating systems, network protocols, system metrics, and infrastructure components with a single tool
- Powerful script APIs allow easy monitoring of in-house and custom applications, services, and systems

Visibility & Awareness
- Centralized view of entire monitored IT infrastructure
- Detailed status information is available through a web interface
- Fast detection of infrastructure outages
- Alerts can be delivered to technical staff via email or SMS
- Escalation capabilities ensure alert notifications reach the right people

Problem Remediation
- Alert acknowledgments provide communication on known issues and problem response
- Event handlers allow an automatic restart of failed applications and services

Proactive Planning
- Trending and capacity planning add-ons ensure you’re aware of aging infrastructure
- Scheduled downtime allows for alert suppression during infrastructure upgrades

Reporting
- Availability reports ensure SLAs are being met
- Historical reports provide a record of alerts, notifications, outages, and alert response
- Third-party add-ons extend reporting capabilities

Multi-Tenant Capabilities
- Multi-user access to web interface allows stakeholders to view infrastructure status
- User-specific views ensure clients see only their infrastructure components

Extendable Architecture
- Integration with in-house and third-party applications is easy with multiple APIs
- Hundreds of community-developed addons extend core Nagios functionality

Stable, Reliable, and Respected Platform
- Scales to monitor thousands of nodes
- Failover capabilities ensure non-stop monitoring of critical IT infrastructure components
