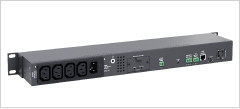
Environmental monitoring
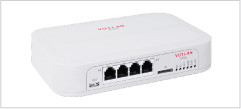
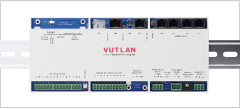
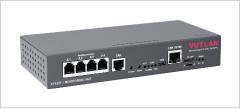
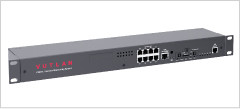
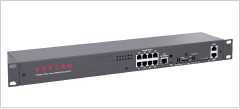
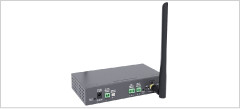
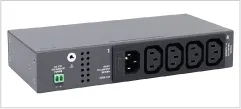
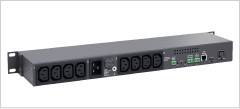
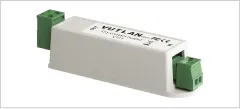
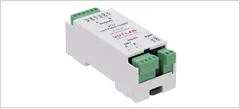
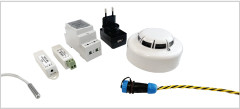
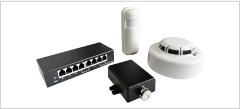
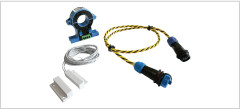
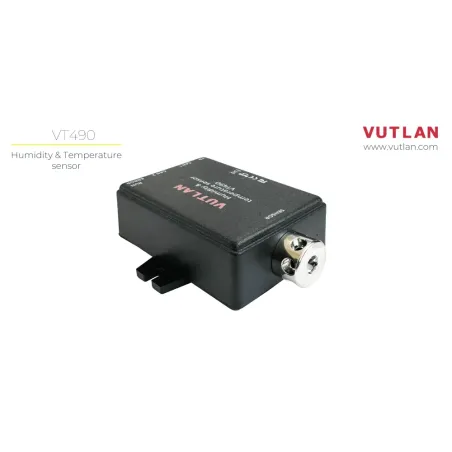
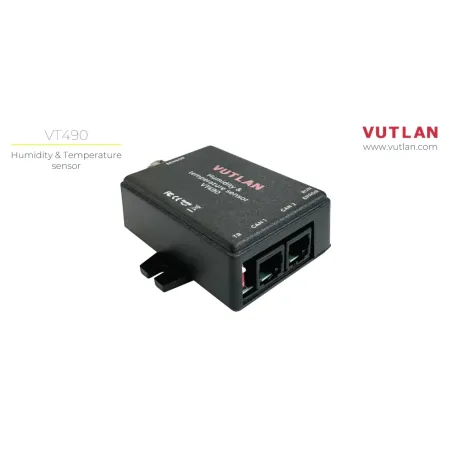
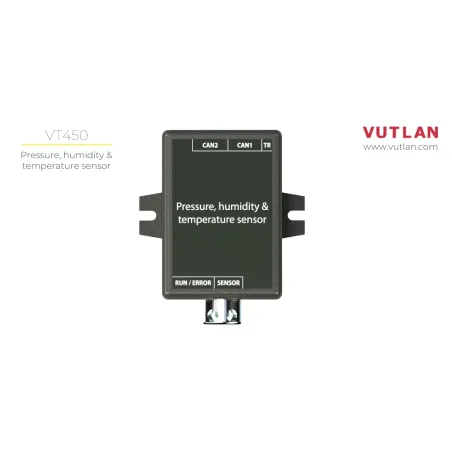
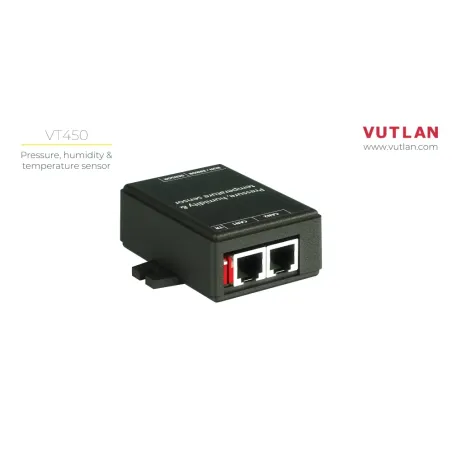
Vutlan offers a very wide range of high-precision sensors.

Vutlan environmental monitoring products enable you to actively monitor the conditions in data centers, BTS stations, warehouses, schools, hospitals, offices, restaurants, farms, factories, zoos, museums or anywhere else you need to protect IT critical assets. Maintaining a stable environment where equipment and/or products are housed is critical for their continued operation, protection and use.
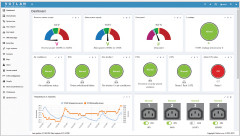
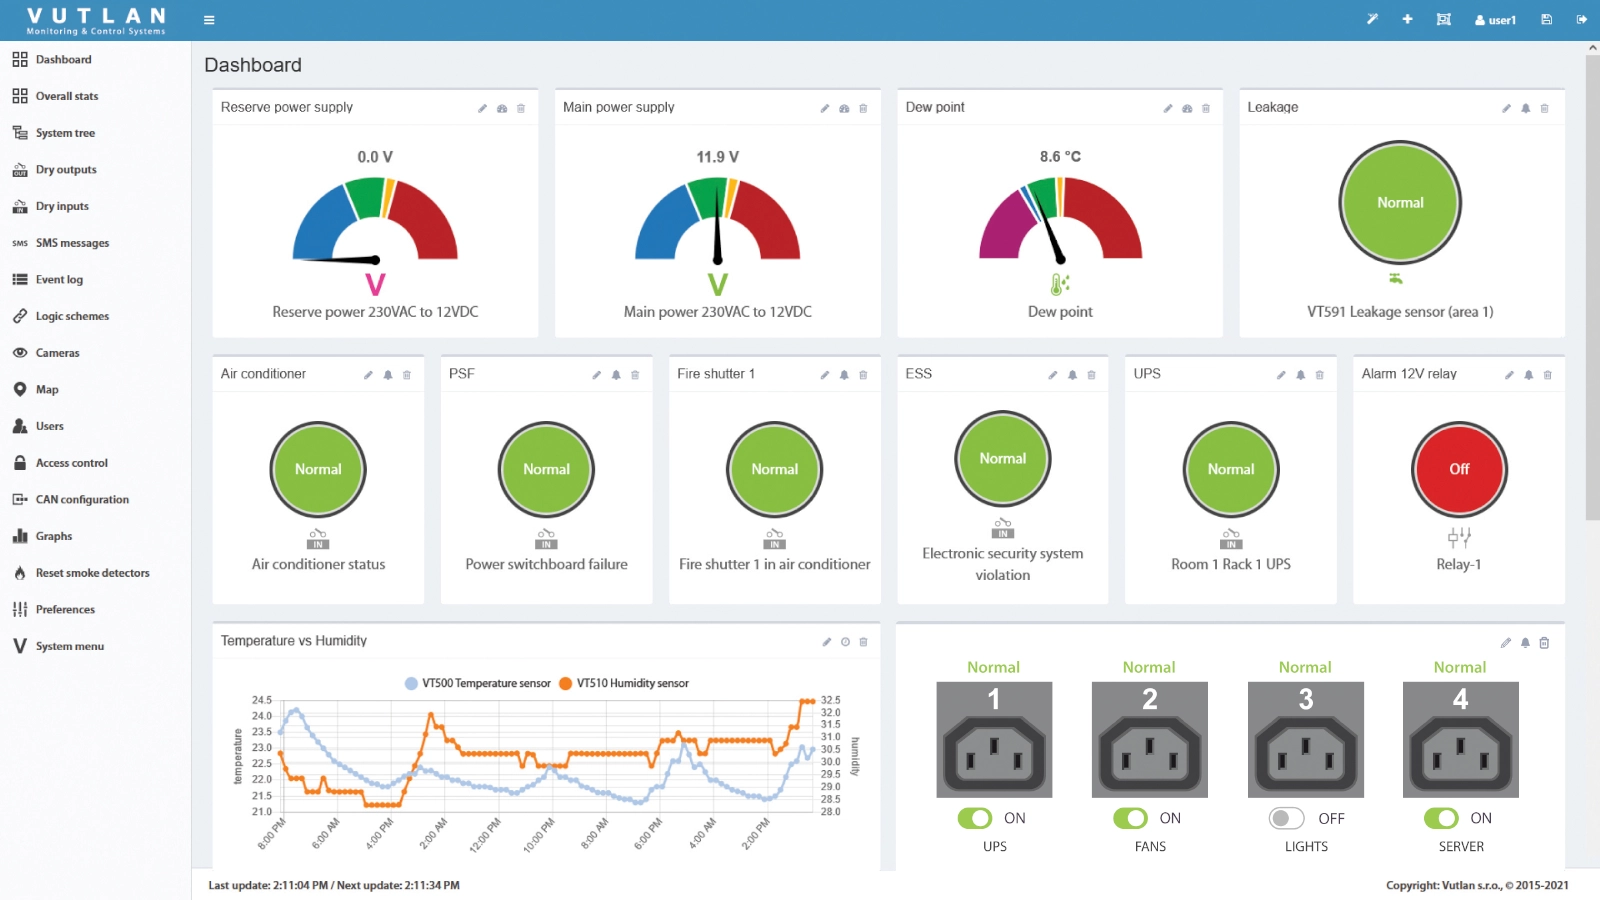
Conditions monitored include extreme temperatures, humidity, power spikes and surges, water leaks, smoke, airflow and etc. Don't ignore environmental threats – remotely manage them with Vutlan monitoring and control systems. Vutlan environmental monitoring equipment allows network operators to observe conditions from a secure Web interface and receive SNMP, email, text message or siren alert notifications when environmental sensors detect a problem. These products can also alert you to potential damage from human error, unauthorized access, or prying fingers that could harm your mission critical equipment. The Web interface can display live video surveillance and environmental measurements, which are logged to track trends.
.webp)
Data Collecting and Graphing
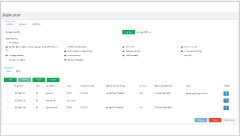
The measurements are periodically stored in the internal memory or external storage media and displayed as graphs. Each graph shows data for the last 100: seconds, minutes, hours, days. The web interface provides an easy way to access these logs for each individual sensor.
Multigraphs
The web interface also allows viewing detailed graphs and data tables for one or more sensors using a multi-plot graph. This is very useful when you need to see sensor data of two or more sensors on the same graph for a given period of time.
.webp)
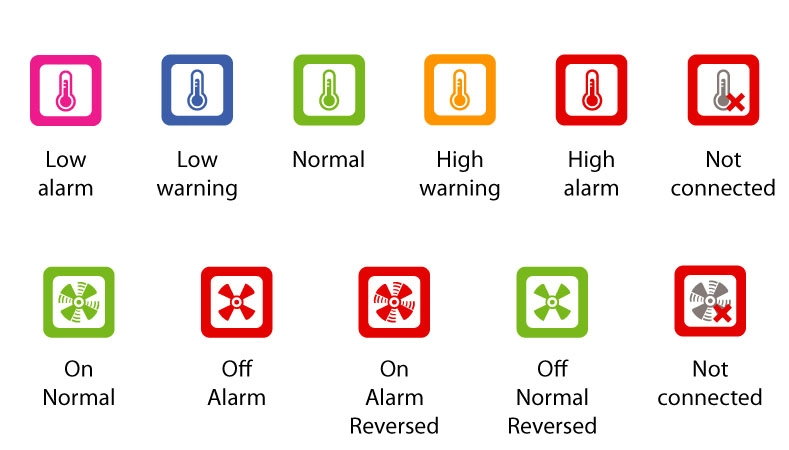
Notifications & Alerts based on Thresholds
When the measured value exceeds the predefined threshold, it triggers an alert: Send Email, SMS, Syslog, Event log, SNMP Trap, SNMP Get, sound and light an alarm beacon or a strobe light. Alerts can be based on thresholds (warning, alert, normal, or not connected) or on multiple conditions.
Vutlan range of sensors

Maintain Optimal Temperature
Locate hot spots within a server cabinet and use collected temperature sensor data to optimize the cooling system and raise the ambient temperature to save energy with confidence that you won’t overheat sensitive IT equipment.

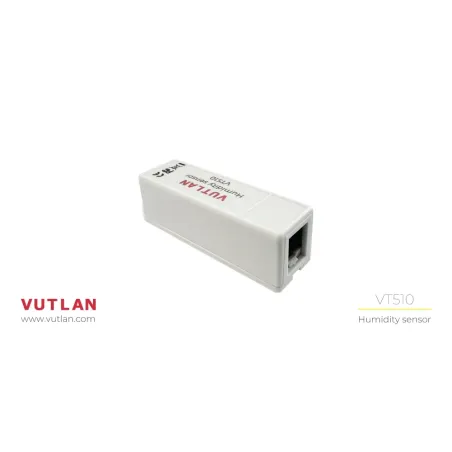
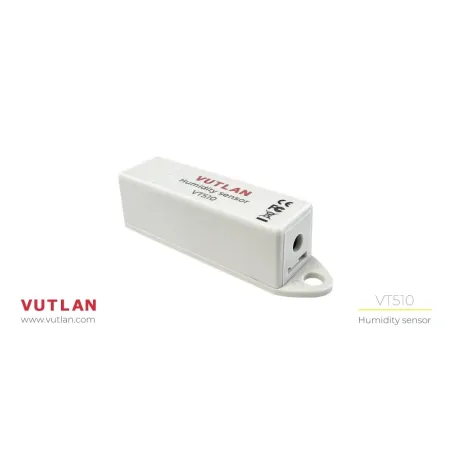
Keep Your Humidity In Check
Humidity in server rooms should be maintained between 40% and 55% rH. High humidity may lead to water condensation which results in hardware corrosion. Low humidity levels may cause issues with electrostatic discharge (ESD) which can cause damage to sensitive components.

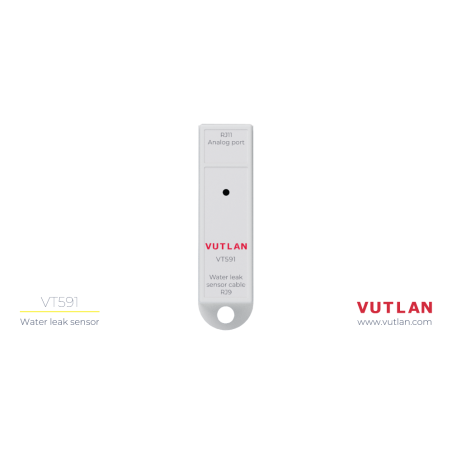
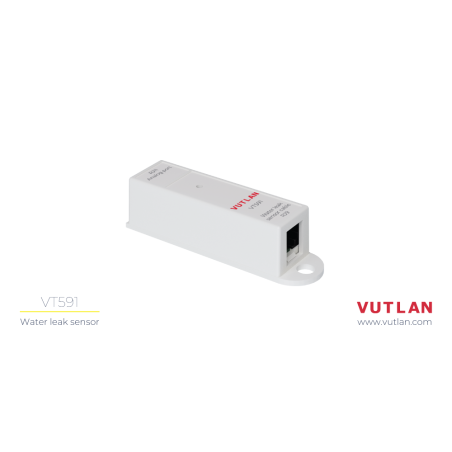
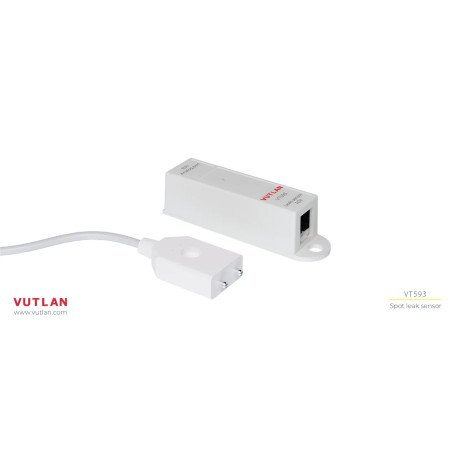
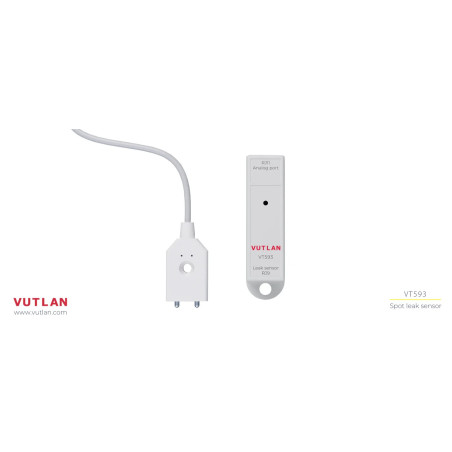
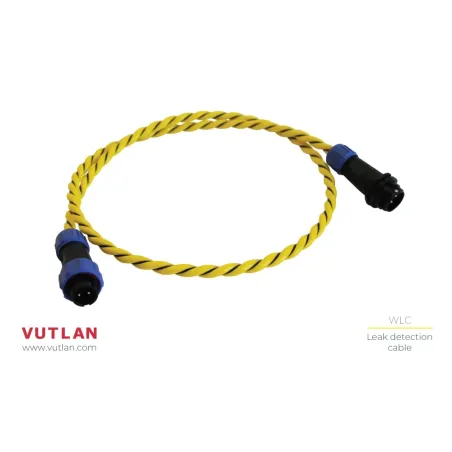
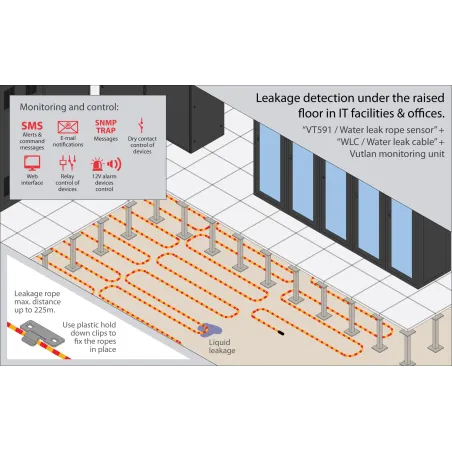
Detect Water Leaks
Detect if there is a water leak from leakage of air conditioning, water-cooled server rack, condensation from air conditioning units, water pipes, groundwater or weather damage. Water sensors should be placed at the lowest point on the floor, and underneath any pipelines.

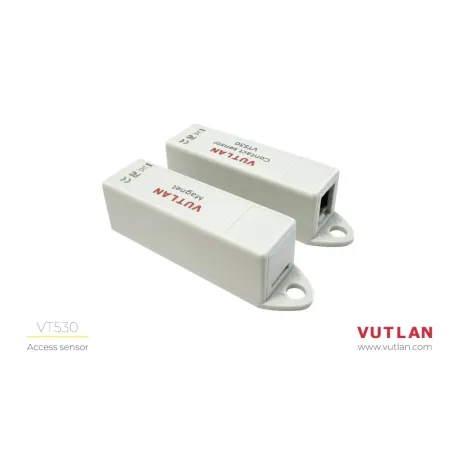
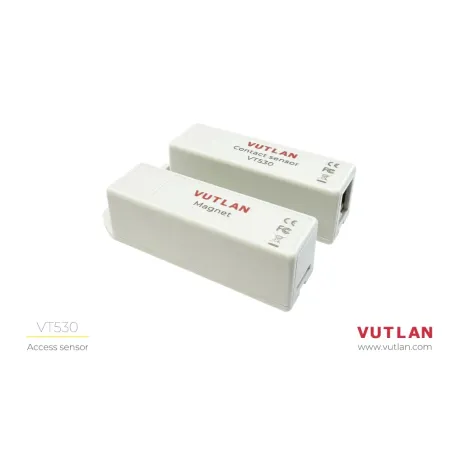
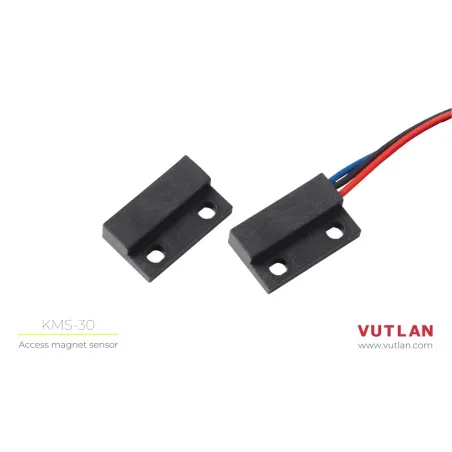
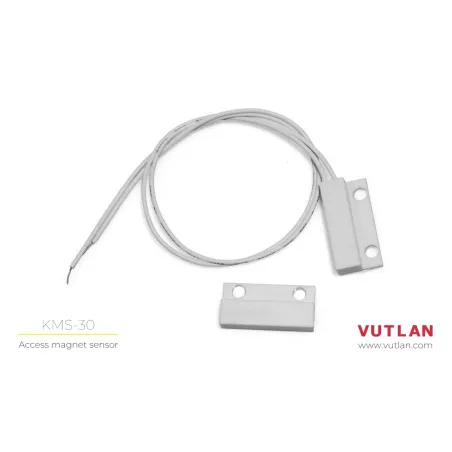
Secure Access
Use contact closure sensors, dry-contacts or PIR sensors to detect the opening and closing of a door of the rack. Trigger an event such as taking a webcam picture when a cabinet door is opened.

AC DC voltage, & current sensors
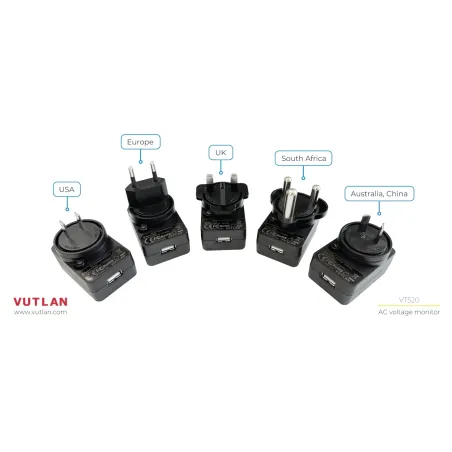
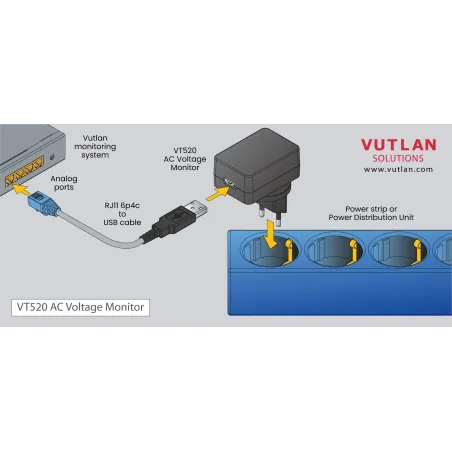
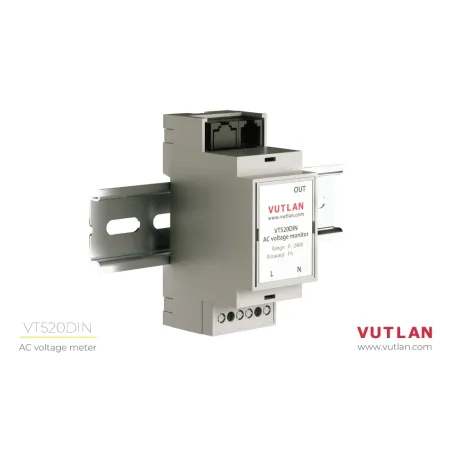
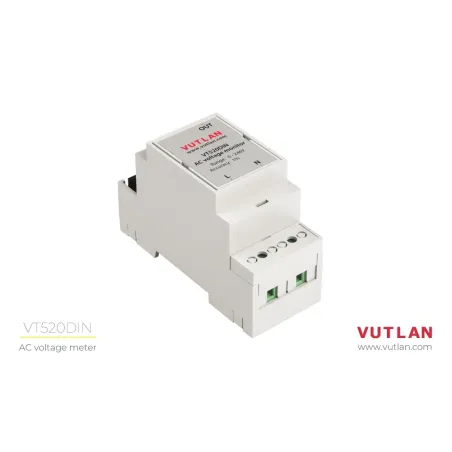
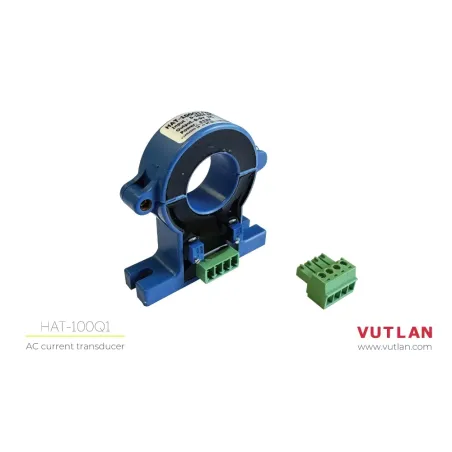
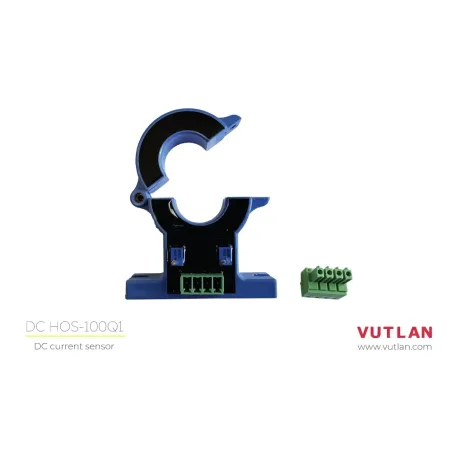
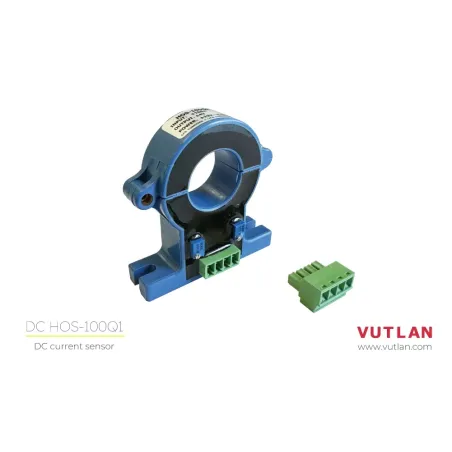
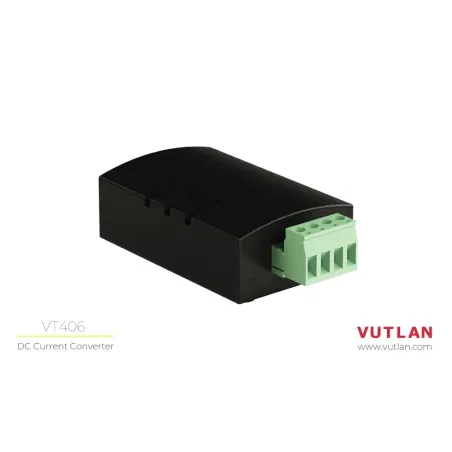
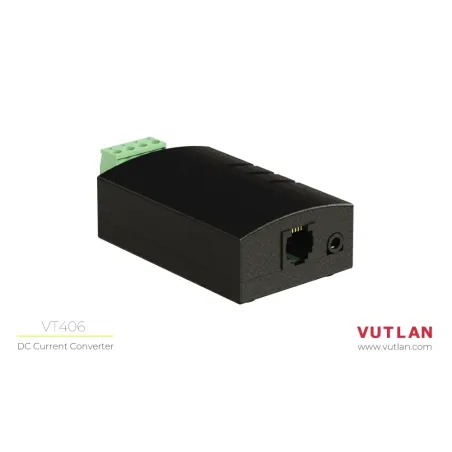
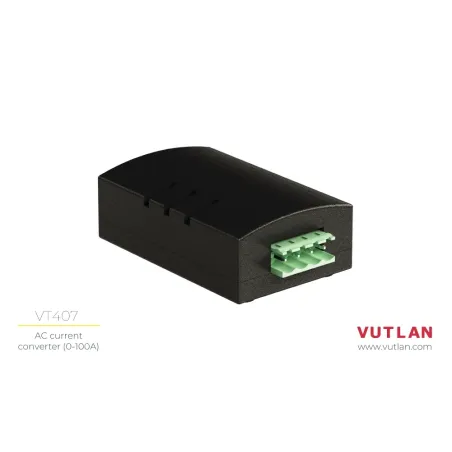
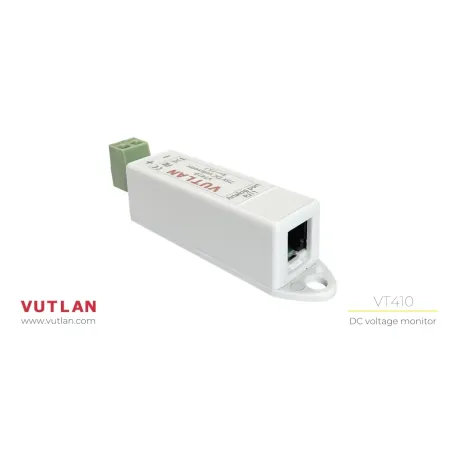
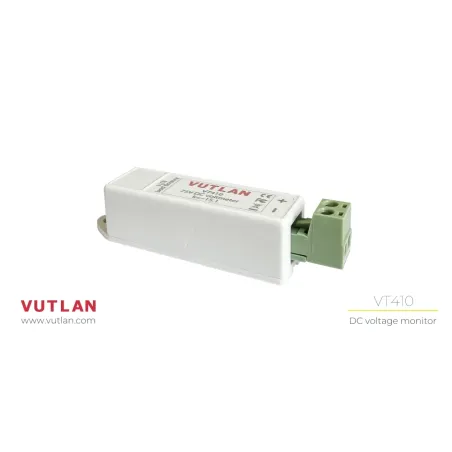
Monitor AC/DC current and voltage (e.g. power supplies, batteries and accumulators) with a variety of Vutlan AC/DC meters.

Smoke / Fire
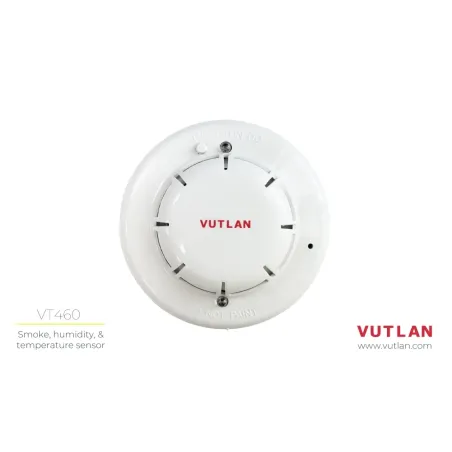
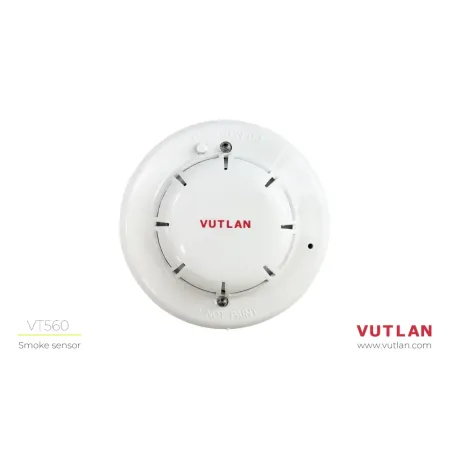
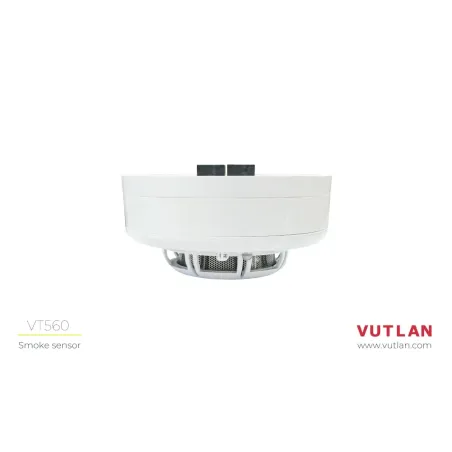
Smoke Detectors can be used to detect the initial signs of component fires in data cabinets. Here, the best approach is to wire the smoke alarms directly into Vutlan environmental monitoring system, essentially extending the functionality of the environmental sensors to the smoke alarm.

Video Surveillance
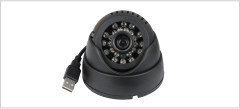
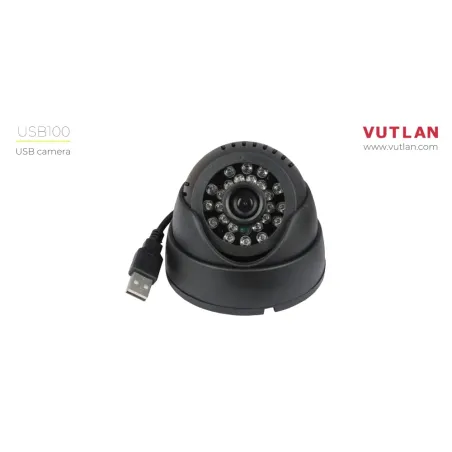
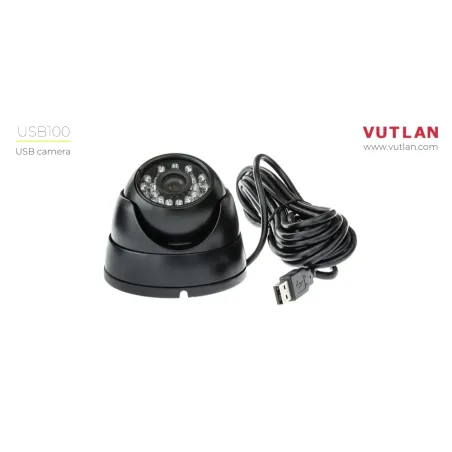
Real-time off-site video surveillance of sensitive areas in the data center or a remote facility can be viewed using Vutlan built-in Web-interface, so administrators can get a first-hand look at the environment wherever they may be.
Sound alarms and Light towers
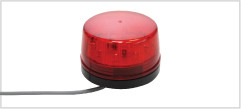
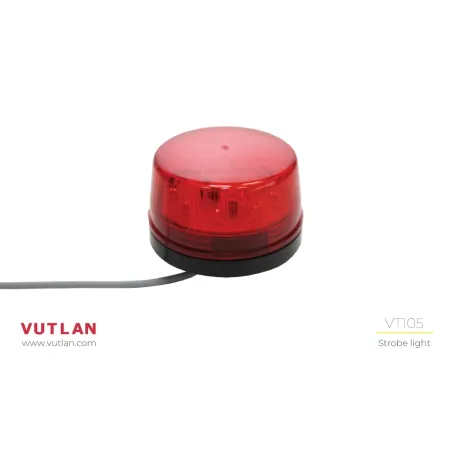
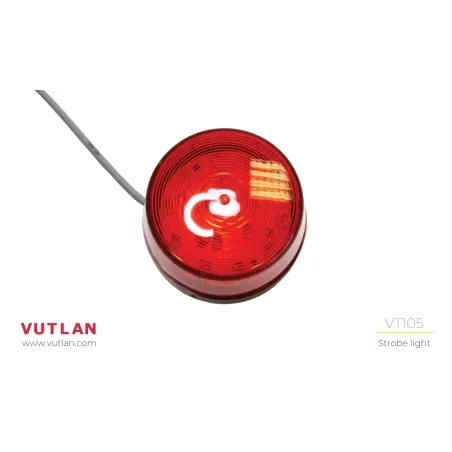
Strobe lights and alarm beacons can be wired to the 12V output of the Vutlan monitoring units to notify the staff of the occurrence of a problem.

Digital outputs / inputs
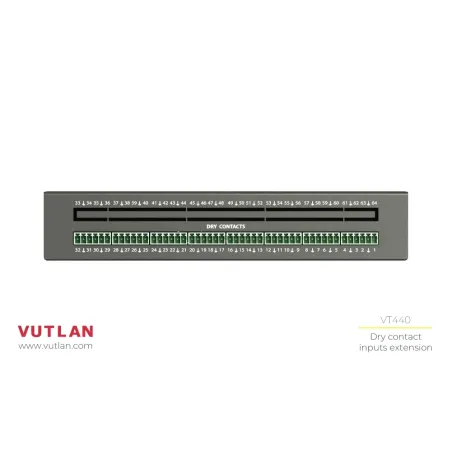
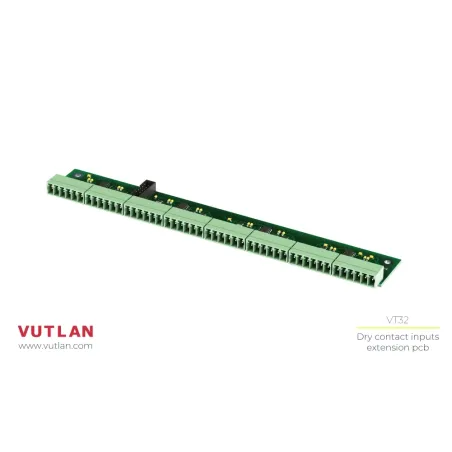
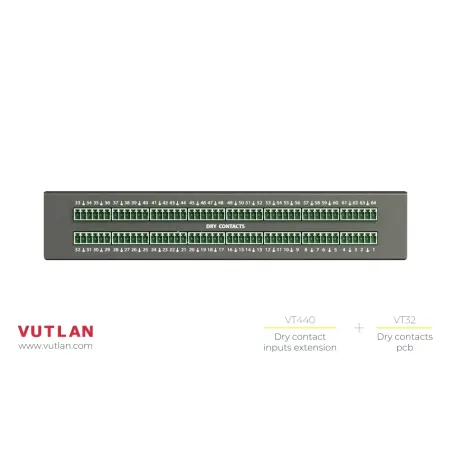
A dry contact input is a voltage-free contact that detects whether or not an input switch is open or closed. It can be easily adapted to third-party sensors and devices. Inside WebGUI, you define what the open or closed condition means. Use dry contacts to monitor alarms such as cabinet doors (open or closed), fire alarms, burglar alarms, and alarms on power systems such as UPSs.

Detect Vibration or Shock Damage
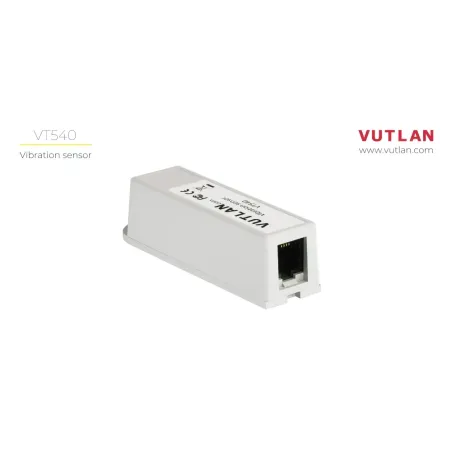
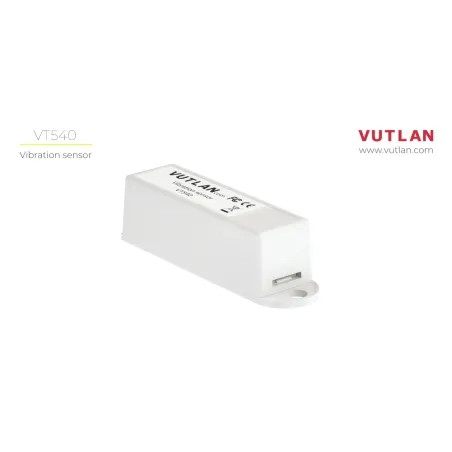
Vibration/shock sensors are used to detect and record tampering, moving, removal, or installation of equipment inside racks, detect and record the level of vibration or shock inside rooms, especially for sensitive equipment (e.g. hard disks). Vutlan shock sensors record the level of shock or vibration and can be possibly used for some types of rotating machines.
